

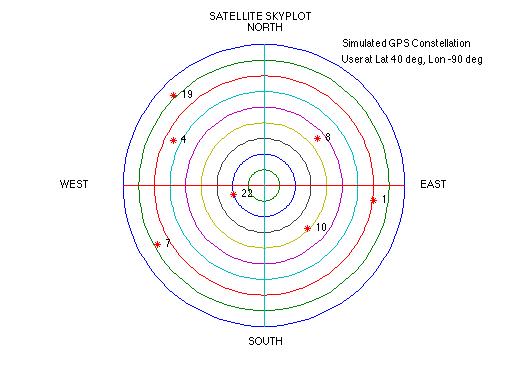
The SatNav Toolbox provides functions that allow users to produce skyplots of satellite positions for simulated constellations as well as for real constellations (via almanac or ephemeris files). Skyplots provide essentially ‘fish-eye’ views of the sky. The center of the plot represents a point directly overhead the specified location. The outermost ring corresponds to the horizon.
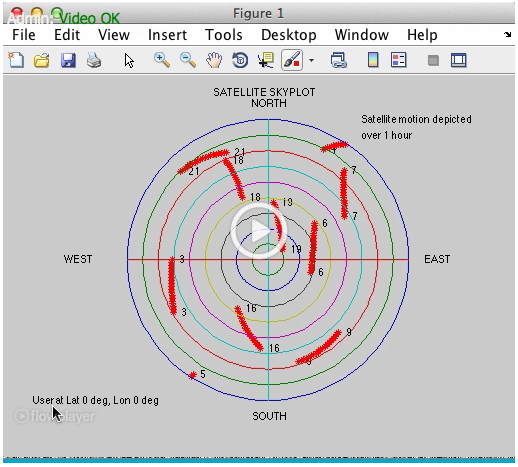
Example programs are also provided to help illustrate how the satellites move across the sky. Here is an example of satellite motion across the sky for a one-hour period for a user at 0 deg latitude (Lat) and 0 deg longitude (Lon):
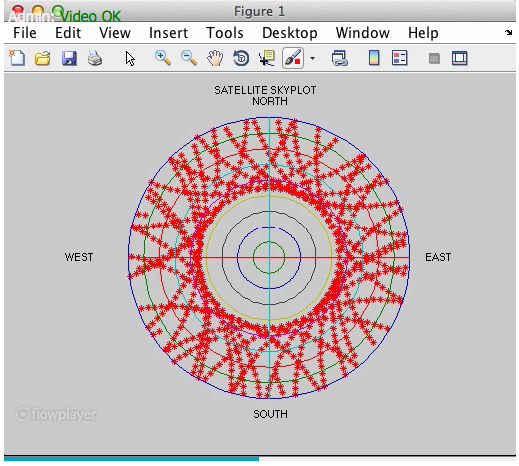
“What happens if we look at the sky over an entire day?”
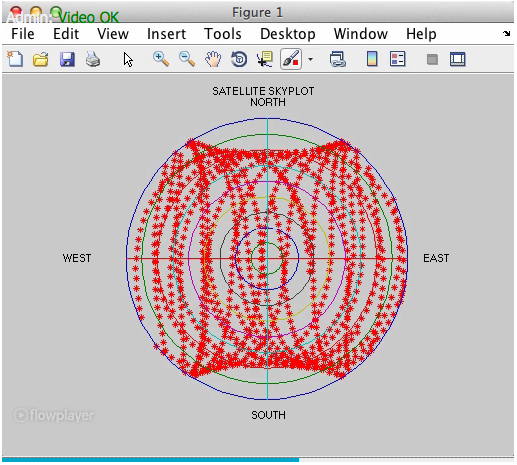
Although satellites appear in most parts of the sky, there are two ‘holes’ in the sky where no satellites ever appear. This is due to the fact that GPS satellite orbital planes are inclined at 55 degrees with respect to the equator. The effect is more dramatic for a user a mid latitude:
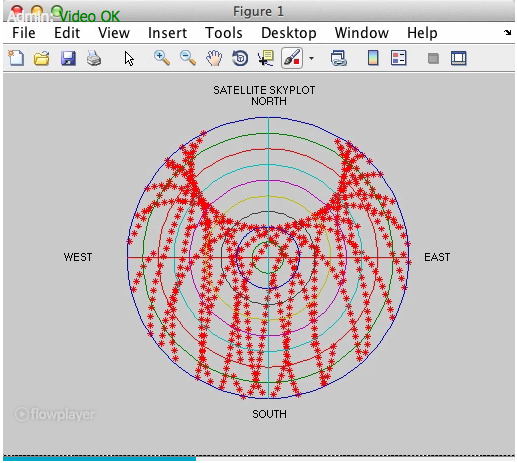
For users in the northern hemisphere there is thus a region in the north direction in which satellites will never appear. If we consider a user very close to the north pole, the ‘hole’ in satellite coverage is directly overhead:
Again, this hole in coverage is due to the 55 degree inclination angle of the satellite orbital planes.