
The SatNav Toolbox allows the user to compute and analyze the effects of dilution-of-precision (DOP). In the example shown here, dual-frequency P(Y)-code pseudorange data was obtained from a continuously operation reference station (CORS) located in Athens, Ohio. Stand-alone (i.e., non-differential) position solutions were calculated with both tropospheric and dual-frequency ionospheric corrections applied. This eliminated the bulk of the bias errors and left primarily noise errors. DOP analysis, strictly speaking, only applies to cases in which the errors on the various measurements are statistically independent (and, ideally, identically distributed).
The following plots illustrate position error components along with scaled DOP values. The DOP values have been scaled for ease of visual comparison with the error plots.
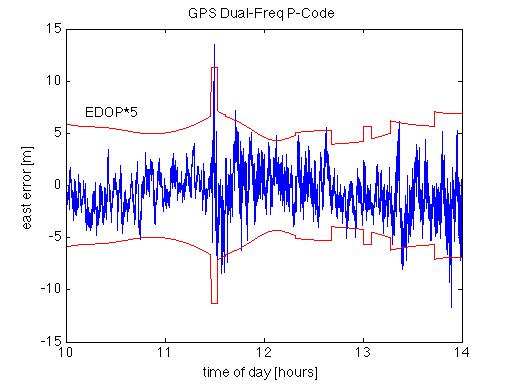
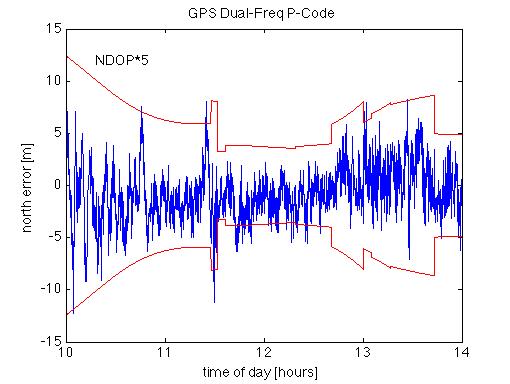
In the east error case, it is observed that error spikes occurring at approximately 11:30 (GPS time) correspond to a spike in the east DOP (EDOP). The correspondence between DOP and error is also clearly evident in the north component:
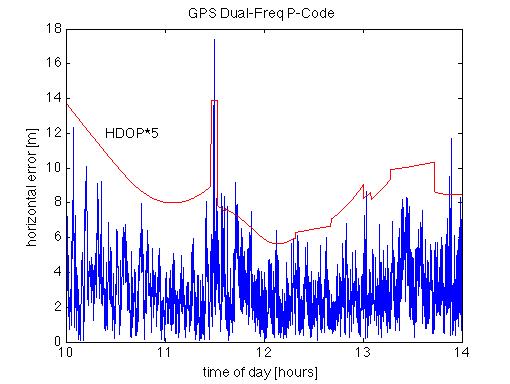
The horizontal error is the root-sum-square of the east and north errors and thus similar behavior is observed:
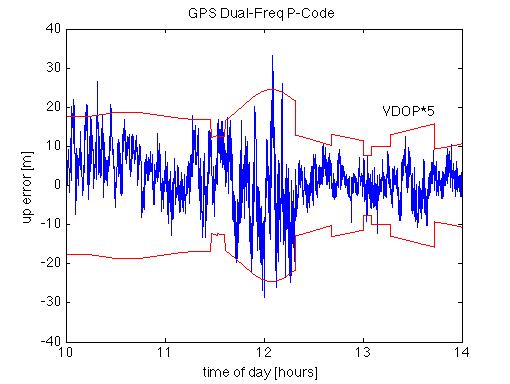
Over the course of the four-hour data collection, significant variations are observed in the vertical error and the VDOP: